Regression Analysis and Forecasting 3.0 Details
Shareware 167 KB
Publisher Description
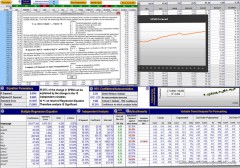
 The Multiple Regression Analysis and Forecasting template enables the confident identification of value drivers and forecasting business plan or scientific data. The multiple regression process utilizes commonly employed statistical measures to test the validity of the analysis and results are summarized in text form to be easily understood. When predictive relationships have been identified by the regression analysis, forecasting can be quickly accomplished based on a range of available methodologies and accompanying statistical strength. An intuitive stepwise work flow enables to develop strong forecasts for projects in a timely manner. The Multiple Regression Analysis and Forecasting model provides simple and flexible input with integrated help icons to facilitate utilization. Results and statistics are explained in a user friendly manner to be understood by users of all levels of statistical expertize. The Multiple regression analysis and forecasting template provides much more functionality than the Excel Analysis Toolpak such as individual regression of all independent variables, the actual level of confidence for the results, and tests of for autocorrelation and multicollinearity. The forecasting process provides options to employ 3rd polynomial, 2nd polynomial, exponential or linear trend lines on independent variables as well as the option to override independent variable forecast data with external analysis. The Multiple Regression Analysis and Forecasting template is compatible with Excel 97-2013 for Windows and Excel 2011 or 2004 for Mac as a cross platform regression and forecasting solution.
Download and use it now: Regression Analysis and Forecasting
Related Programs
Pricing and Breakeven Analysis Excel
Pricing and Breakeven Analysis Excel will determine the impact of a price change on your business. It calculates current breakeven points using revenue, variable cost, and fixed cost inputs. These are combined with estimates for price and sales volume variations...
- Demo
- 20 Jul 2015
- 315 KB
Analysis Lotto
Which seems like the better bet to you: Pick 6 lotto numbers from 50 possibilities ... or pick 6 numbers from only FIFTEEN? Let Analysis Lotto show you how to pick winners for ANY lotto or keno game from a...
- Shareware
- 11 Aug 2016
- 1.35 MB
Data Analysis
'Data Analysis' is a package with basic statistical data checks. It includes both one- and two-dimensional data visualization and evaluation of most used sample characteristics like average, deviation, skewness, kurtosis, antikurtosis, Pearson's variation coefficient etc. One-dimensional data is grouped by...
- Freeware
- 20 Jul 2015
- 2.34 MB
Analysis Center
This sophisticated piece of software turns your computer into a modern, State of The Art spectrum analyzer giving you features that go far beyond the possibilities of any stand-alone hardware unit.An important advantage of your new analyzer software is the...
- Shareware
- 20 Jul 2015
- 2.56 MB
Pricing and Breakeven Analysis
Pricing and Breakeven Analysis Excel will determine the impact of a price change on your business. It calculates current breakeven points using revenue, variable cost, and fixed cost inputs. These are combined with estimates for price and sales volume variations...
- Shareware
- 15 Apr 2017
- 105 KB

